How to simplify C4 Modelling in Enterprise Architect

The C4 Model is a lean graphical notation technique for modelling the architecture of software systems.

The intention of this post is not to sell you on this approach.. or convince you that you should use EA to produce C4 Diagrams. But rather it is aimed at those Solution Architects who need to knock up C4 models quickly but also need to share and associate these models back into the Enterprise Architecture repository to support alignment, road mapping and traceability purposes.

Sparx Systems provides a free C4 MDG download which provides a C4 shape toolbox which can be used when creating Context, Container, Component and Class (Code level) diagrams.


Using EA to produce C4 Diagrams has it’s benefits.. unfortunately speed is not one of them.

For over 10 years, EA was my modelling tool of choice.. the last couple of years however has seen a shift from me doing EA styled models to doing solution oriented abstractions which live along side the code.

The diagrams, like the code, are managed under the same version control system.

Arguably, this does not obviate the need to have a solution view and a consolidated Enterprise View. But rather introduces the challenges of how can the two easily sit alongside one another.

The C4 abstractions applied at a solution level are equally applicable at an Enterprise Level. The abstractions provide context and assist in navigating the varying levels of detail needing to be communicated across a broad spectrum of stakeholders.

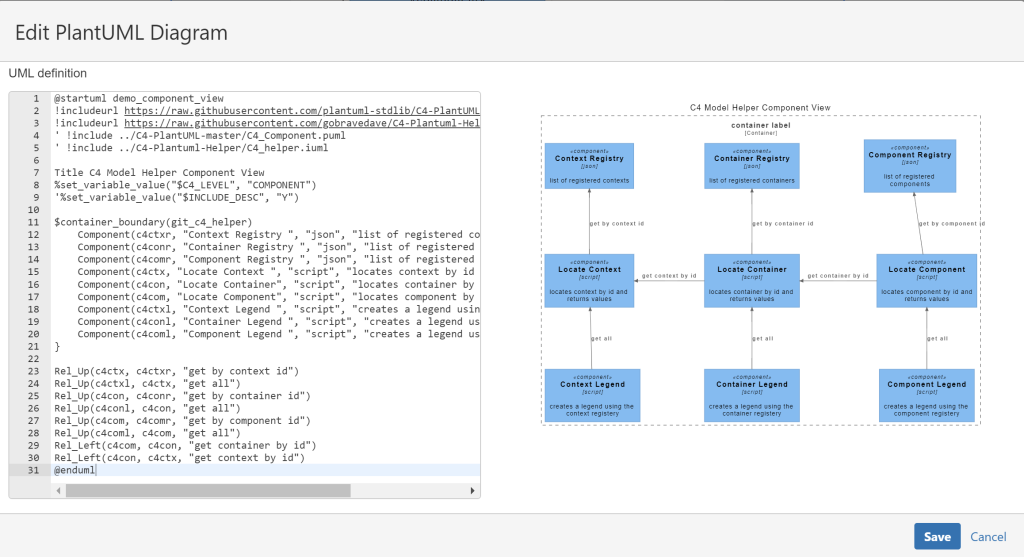
The 20 lines of script on the right rendered on the PlantUML Online Server as:

The same script, by following the steps below creates the C4 diagram within Enterprise Architect:

  • create a new C4 diagram in EA
  • add a note element onto the diagram and paste the desired plantUML script into it
  • right click the Note element and select Run PlantUML Script

The script does a pretty good job of adding the C4 stereotyped elements to the EA project and laying them out on to the diagram.

The script supports multi/nested boundaries and utilises a left to right layout algorithm.

Some known limitations at present..

  • placement of object based on connectors.. eg Rel_Up, Rel_Right etc
  • no dynamic stereotype creating or overriding of colours
  • stereotyped person & connectors is not picking up the UML styling
  • adding url links to objects or connectors
@startuml
!include https://raw.githubusercontent.com/plantuml-stdlib/C4-PlantUML/master/C4_Container.puml
'!include https://raw.githubusercontent.com/plantuml-stdlib/C4-PlantUML/master/C4_Dynamic.puml
' uncomment the following line and comment the first to use locally
' !include C4_Container.puml
'LAYOUT_TOP_DOWN()
'LAYOUT_AS_SKETCH()
'LAYOUT_WITH_LEGEND()
title C4 Container View via script
AddElementTag("Service", $shape=EightSidedShape(), $bgColor='Lightblue',$legendText='service (eight sided)')
AddRelTag(Alert, $textColor="red", $lineColor="red", $lineStyle = DashedLine(), $legendText="console triggered")
AddRelTag(Synchronous, $textColor="black", $lineColor="dimgrey",$legendText="Synchronous")
AddRelTag(Asynchronous,$textColor="black", $lineColor="dimgrey", $lineStyle = DashedLine(), $legendText="Asynchronous")
Container_Boundary(boundary, boundary){
Container(Container1, "Container one", "Application")
Container_Boundary(boundary2, boundary2){
Container(Container3, "Container three","service", $tags='Service', "description")
ContainerDb_Ext(Container4, "Container four","storage", "desc")
Container(Container5, "Container five","Application", "container 5 description")
Container(Container6, "Container six","Application", "container 6 description")
}
}
ContainerDb_Ext(Container2, "Container two","storage", "desc")
Rel(Container1,Container3,"blah","Synchronous", $tags=Synchronous)
Rel(Container1,Container5,"blah5","Synchronous", $tags=Synchronous)
Rel(Container1,Container6,"blah6","Synchronous", $tags=Synchronous)
Rel_R(Container3,Container4,"blah2","Alert", $tags=Alert)
Rel(Container3,Container2,"","Asynchronous", $tags=Asynchronous)
SHOW_LEGEND()
@enduml

The Create PlantUML script can be used to support the EA to PlantUML round trip.


Refer to https://github.com/gobravedave/Enterprise-Architect for the code and installation instructions.

Software Architecture Diagram Tooling Discovery

The following post is a collection of notes, links and learnings associated with a review of diagram/modelling tools to be used to create and maintain software architecture documents.

Needs Analysis

The evaluation is based on the following needs:

  • easy to use
  • UML diagram support
  • text based to support diagrams as code concepts
  • visual studio code previewer
  • support for C4 Modelling would be nice
  • render in mark down
  • render in github pages
  • render in confluence
  • add link to support navigation
  • layers to support animation would be nice

Tools Reviewed

The following tools have been reviewed:

  • PlantUML
  • Diagram.net (previously DrawIO)
  • Mermaid
  • Lucidchart
  • Structurizr
  • Gliffy

Comparison Summary

NeedPlantUMLDrawIOMermaidLucidchartStructurizrGliffy
UML YesYesYesYesNoYes
Diagrams as CodeYesNoYesNoYesNo
Easy To UseYesYesYesYesNoNo
Visual Studio CodeYesYesYesNoYesNo
C4 ModelsYes Yes Sort ofYes Yes No
MarkdownYes Yes Yes NoSort ofNo
Github PagesSort ofSort ofYesSort ofSort ofSort of
Confluence Yes Yes Yes Yes Yes Yes
LinkingYes Yes Yes Yes Yes Yes
LayersNoYes NoYes NoYes

More details follow for each tool reviewed.


PlantUML

Jebbs VSC extension has a 5 star rating and provides the ability to preview, save diagrams as svg/png.

The following extension setting allows you to render the PlantUML script when previewing a markdown document in Visual Studio Code.

"plantuml.server": "https://www.plantuml.com/plantuml"

Only use https://www.plantuml.com/plantuml if you are OK to share your diagrams. The alternative is to setup you own server which is beyond the scope of this article.

C4 Modelling is supported via the inclusion of plantuml-stdlib into your script.

@startuml Basic Sample
!include https://raw.githubusercontent.com/plantuml-stdlib/C4-PlantUML/master/C4_Container.puml
Person(admin, "Administrator")
System_Boundary(c1, "Sample System") {
        Container(web_app, "Web Application", "C#, ASP.NET Core 2.1 MVC", "Allows users to compare multiple Twitter timelines")
}

System(twitter, "Twitter")
Rel(admin, web_app, "Uses", "HTTPS")
Rel(web_app, twitter, "Gets tweets from", "HTTPS")
@enduml

The above script sourced from https://github.com/plantuml-stdlib/C4-PlantUML#readme renders within the markdown document as per screen shot, however it does not automatically render when I publish to github.

There is a generate PlantUML make action which could automate the rendering.. but this looks like it would require the PlantUML script to be managed as a separate file and automates the generation of an image to being included into your markdown. I will put this on my backlog.

Linking is possible by including hypertext links on objects. So it is possible to add but it is fragile and is not really testable within Visual Studio Code.

The jonashackt/plantuml-markdown repository contains details on how to Integrate the PlantUML render engine into a GitHub markdown.

![demo-linking](http://www.plantuml.com/plantuml/proxy?cache=no&src=https://raw.githubusercontent.com/gobravedave/C4-Plantuml-Helper/markdown-discovery/demo_linking.puml)

The renders well in markdown in Visual Studio Code and Github

If working in confluence is your thing then you will need to have the PlantUML extension installed.

PlantUML is not so good at big complex diagrams. It is possible to add layout hints to the diagram but at times the results are bewildering. Maybe this is a excellent case for keeping the diagrams simple.

Diagram.net

See Visual Studio marketplace for the 5 star unofficial extension which integrates Draw.io (also known as diagrams.net) into VS Code.

A simple and easy interface to allow you to create and edit multi layer SVG files and imbed them into your markdown document.

And with the help of the C4-Draw.io plugin you can get a head start on creating navigable C4 models in no time.

Technically speaking this tool does not support diagram-as-code. The underlying drawio.svg file is text based, however it does not look like something you could easily spot what has changed from one version to another using differencing tool.

The exported svg, however does not appear to honour the links.

Mermaid

The Markdown Preview Mermaid Support visual studio code extension makes is easy to script out a diagram and render it within your markdown document while in Visual studio code.

URL links can be added using the link key word.

classDiagram
class thing
thing <|-- scissors
thing <|-- paper
thing <|-- rock
link thing "https://gobravedave.atlassian.net/wiki/spaces/DISCOVERY/pages/425985/Mermaid+Demo" "This is a tooltip for a link to thing"
link scissors "https://gobravedave.atlassian.net/wiki/spaces/DISCOVERY/pages/819224/scissors" "This is a tooltip for a link to link to scissors"
link paper "https://gobravedave.atlassian.net/wiki/spaces/DISCOVERY/pages/753723/paper" "This is a tooltip for a link to paper"
link rock "https://gobravedave.atlassian.net/wiki/spaces/DISCOVERY/pages/655411/rock" "This is a tooltip for a link to rock"

The mermaid script rendered within the markdown document via Visual Studio Code and Github.

Confluence is good to go with the Mermaid confluence plug-in.

 Mermaid supports the creation of various types of diagrams. C4 Models is not one of them, however I assume you could probably roll your own via the flowchart shapes.

Or alternatively follow the lead shown by Structurizr export as Mermaid capability.

 This is the script generated by Structurizr.

graph TB
  linkStyle default fill:#ffffff

  1["<div style='font-weight: bold>User</div><div style='font-size: 70%; margin-top: 0px'>[Person]</div><div style='font-size: 80%; margin-top:10px'>A user of my software system.</div>"]
  style 1 fill:#08427b,stroke:#052e56,color:#ffffff
  2["<div style='font-weight: bold'>Software System</div><div style='font-size: 70%; margin-top: 0px'>[Software System]</div><div style='font-size: 80%; margin-top:10px'>My software system.</div>"]
  style 2 fill:#1168bd,stroke:#0b4884,color:#ffffff

  1-. "<div>Uses</div><div style='font-size: 70%'></div>" .->2

Lucidchart

Sign up for free and then work out your plan starting from $10 per month per user?

Great range of diagrams including a C4 Model template.

Lucidchart is pitched at being a cheaper replacement for Viso, which I am sure it is, but it missed the mark for me in being able to support the concept of diagrams-as-code.

Confluence is an option for you via the Lucidchart Diagrams Connector plug-in.

I am guessing you could include links into diagrams and the output can be exported as SVG and included into markdown documents.

Structurizr

Structurizr is a collection of tooling to create software architecture diagrams and documentation based upon the C4 Model.

This tooling is more than a diagraming tool. It effectively becomes an asset and component registered where you define an asset and then use it in one or more diagrams.

Structurizr focus is on C1 to C3.. i.e. Context-Container-Component. The code level diagrams however appears to be handed off to code based IDEs.

Pricing starts at $5 per month for cloud hosted workspaces.

Models can be published to confluence via HTML iframe macro or the structurizr macro. Alternatively it is possible to export models in PlantUML, C4-PlantUML and Mermaid formats.

Diagrams as code can be supported via the C4 DSL Extension.

The tool is well documented and sample C4 DSL is available. The learning curve from this tool is steeper than all the tools above.

My review of Structurizr stops here. I did not create any models using the DSL extension nor attempt to publish/render diagrams in markdown and or github.

Gliffy

Handy if you do all your authoring and collaboration in confluence. You can knock up a diagram using a graphical user interface, shape libraries and connectors.

No Visual Studio Code plug-in appears to be available.

The gliffy UI manages diagram revisions by timestamp.. but it does not provide a view of what has changed.

Gliffy can be used to do C4 Modelling however it is very basic. Looks like you would need to create your own diagram to be used as a template.

Navigation between C4 Layers can be accomplished via using diagram layers or external links.

Using Layers provides a more usable experience as you can go full screen and zoom in and out of the C4 stack with out opening up new browser tabs.

But not all uses cases could be solved via layers.

A markdown version of this post and associated diagrams/scripts are available on my gobravedave github repo.

Color Picker

Within PlantUML you are able to assign colors to an object or connector by using the the following values:

  • Hex RGB value eg #AABBCC
  • Standard HTML Colors eg #LightBlue
  • Special PlantUML names i.e. Application, Implementation, Motivation, Physical & Technology

Managing colors in EA is quite a complex topic. Each element type has a default color and it is also possible to apply default colors based on stereotype (via UML type setting or MDG UML Profile) or via shape scripts and driven possibly by a tagged value.

A modeller can override a default cold via the GUI using color palette.

Behind the scenes, Enterprise Architect will store the value of -1 if a default color is to be applied. If the default has been updated by the modeller, then the value is a decimal representation of the Blue Green Red components of the color is stored.

Hence the need to have a sub routine to allow a PlantUML color code to be converted into the decimal equivalent to be applied to an EA modelling element during the Create Sequence Diagram script.

Likewise when Generating the PlantUML script there is a requirement to take the decimal version and output the #colorname or #rrggbb value.

Refer to thepost relating to how to Create a Sequence Diagram for details of location of the color-picker script and the installation instructions.

The common functions available are:

  • ColorHexByName (colorName) where a #colorname is supplied as input and the hex RGB value is returned
  • ColorNameByHex (colorHex) where a hex RGB is supplied and the color name, if exists is returned

Generate PlantUML Script using Enterprise Architect

In my first blog posting, I described the method by which a sequence diagram described using PlantUML script can be imported into Sparxs Enterprise Architect. The solution utilised a set of VBScripts which I hacked together to parse the input, search for existing objects, create new elements and then layout the diagram object and links.

Model Management however is not just about being able to import sequence diagrams. The use case may exist in your organisation where diagrams require to be validated against some Enterprise standards, checking for duplicates within the model, for duplication against an Application Portfolio, naming standards, organisational context; all metadata which extends beyond the basic sequence diagram which has been described.

Hence these diagrams and/or the underlying modelling elements may well be updated within Modelling environment and there is a need to refresh one or more PlantUML scripts.

Follow the installation instructions as per per the Create a sequence diagram post and create a new VBScript called “Generate PlantUML script” using the code from https://github.com/gobravedave/Enterprise-Architect.

The following steps outline the process of generating a PlantUML script from a sequence diagram within EA:

  1. open up an existing sequence diagram
  2. add a note element to the sequence diagram
  3. right click the Note element and select “Generate PlantUML script”
  4. the script will parse the diagram objects and links with the results loaded into the note object.

This script preceded the import script and was the basis of discovering where various information about the diagram and underlying modelling objects are stored within EA.

Simliar to the Import script, there are a number of backlog items I am considering to introduce including:

  • support other diagram types e.g. use case, class diagrams
  • publish directly to confluence pages
  • support titles, dividers and notes

Create a Sequence Diagram in Enterprise Architect using PlantUML

I am a fan of PlantUML; it is accessible, easy to use and you produce nice looking diagrams with minimal effort in a short period of time. The PlantUML script can be published and made available for collaboration.

The problem however it that the PlantUML script used to generate the diagrams are discrete declarations of behaviour. Validation and alignment against the Domain and or Enterprise landscape would typically be manual and the likely outcome would be model divergence.

The cost savings from the speedy delivery of fit for purpose models is long forgotten when the time comes to make changes.

I do believe there is a middle ground.. where Enterprise and Delivery teams operating at differing speeds can effectively work together. The solution centres around the ability to exchange models between the modelling platform and the script based diagraming tools.

Enterprise Architect does offer a number of methods for model exchange. The simplest being CSV imports, for high order elements, through to XMI import/export for full element, association and diagrams objects.

PlantUML does support XMI export, however at this point it only applies to Class diagrams.

So one solution to close this gap, I have cobbled together a VBScript to run with Enterprise Architect to allow a modeller to Generate a Sequence Diagram using a PlantUML script..

The following screen shot provide an example of what functionality is offered by the scripts.

  • participant types of actor, control, boundary, entity and database
  • boxing timeline elements
  • color coding using either #RGB or HTML standard colors
  • synchronous, asynchronous, return and message to self flows
  • message grouping (alt, loop, critical etc)
  • activate and deactivate of timelines
  • return value and parameters

Sample PlantUML Script

Actor Schedular as S
Box System #lightgreen
Control Job
Participant widget
End Box
S ->> Job: before trigger()
loop process back log
Else job in queue
S ->> Job: trigger1()
Else after 1 hour
S ->> Job: trigger2()
Alt waiting over 2 hours
Else after 3 hours
S ->> Job: trigger3()
Job -> widget: do something
widget –>> Job: return
Job -> Job: process it
S ->> Job: trigger4()
Else after 4 hours
S ->> Job: trigger5()
activate Job
End
End
S ->> Job: after trigger()
deactivate Job

PlantUML Sequence Diagram

The following steps outline the process of creating the sequence diagram within EA:

  1. create a new sequence diagram
  2. add a note element and paste the desired plantUML script into it
  3. right click the Note element and select “Create Sequence Diagram via PlantUML”
  4. the following diagram is created

EA’s does have some restrictions on the way the flows can be laid out using the API.. and this is especially evident when using nested InteractionFragments. So please check the produced diagram to ensure correct flow placement.

The following features will be added overtime.

  • header and footer
  • coloring of the flows & activations
  • notes
  • dividers
  • dialogue box to select PlantUML script from file the source repository or confluence page

Installation Instructions

Source code can be found at https://github.com/gobravedave/Enterprise-Architect


Download the collection of vbs files

In the scripting window with EA

  1. Create a new Diagram Scripting Group and name it “PlantUML
  2. Create a new VBScripts and name it “Create Sequence Diagram via PlantUML
  3. Cope and paste the contents of the file downloaded
  4. Creates a new Normal Scripting Group and name it “Common
  5. Create a VBScript for each of the following vbs files downloaded:

Note.. Script names are case sensitive.

Interested in your thoughts, recommendation and in the spirt of collaboration, I am more than happy if you want to check out the scripts and make any necessary updates.